SNAP Cuts Take $10bn Out of US Grocery: What Falling Volumes Mean for Food and Beverage Brands
US grocery units fell 1.8% in June while prices still rose, as tighter SNAP rules pulled about $10bn of food aid out of the market. The loss sits in a handful of aisles, and the shoppers carrying it have moved to mass and dollar stores.
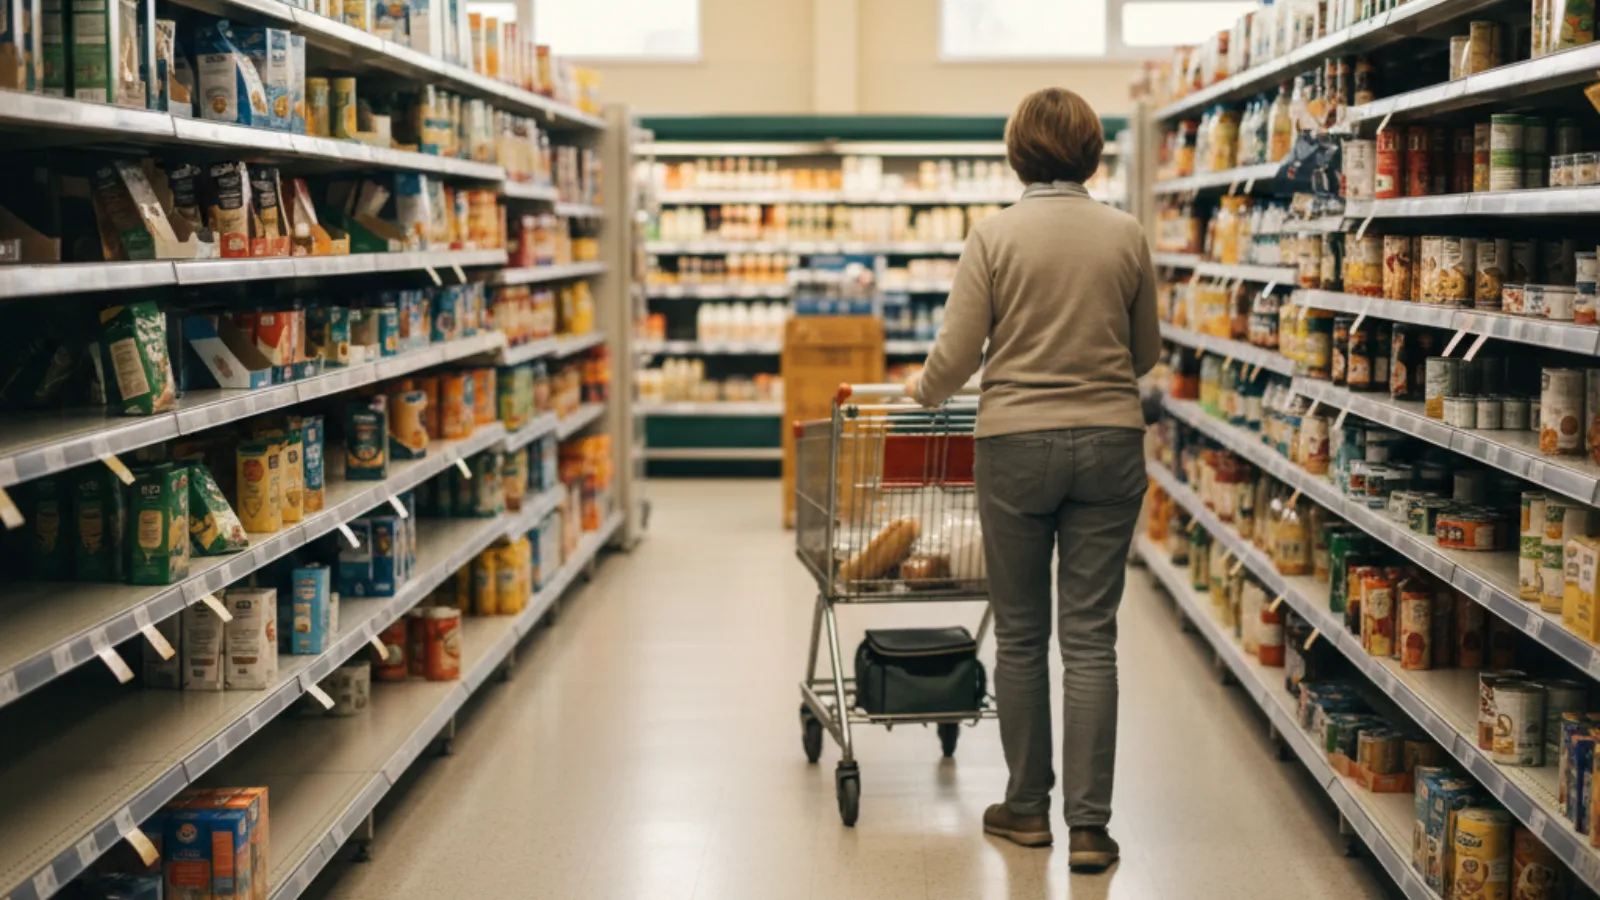
I keep seeing the same ending. A food firm covers a soft year with price, books it as growth, then finds the shopper gone.
The cover has now run out in the US. Bain and NielsenIQ put June units down 1.8% on the year before. In June 2025 units rose 0.1%. Prices are still climbing 2% to 3%. Price rises can no longer hide the fact that shoppers are buying fewer packs.
A ten billion dollar hole in the food aid budget
Circana traced most of the drop to one change in the law. HR 1 passed in July 2025 and changed who qualifies for SNAP, the US food aid scheme. The new rules took effect on 1 February 2026 and checks began a month later.
Sign-ups fell fast. Circana counted a drop of about two million homes in the first quarter, close to 11% down on the year. Federal counts show 36.6m people on the scheme in May, against 42.2m a year earlier. Circana puts the lost EBT funds at about $10bn in 2026 against 2025.
The share figures are starker. Baskets paid with SNAP funds were about 10.4% of all US retail food and drink dollars two years ago. That is now 7.3%. Trip share fell from about 8% to under 6%. Three points of the whole US food and drink pool have left one payment type in two years.
The loss sits in a handful of aisles
One US-wide number hides where the money left. NIQ asked SNAP shoppers what they would change. 65% said they would buy less of at least one big shelf. That list runs through cookies, bakery, chocolate, frozen dinners, condiments, sweets and ready meals.
79% said they would buy more of at least one staple. That list is bread, eggs, milk, cheese, rice, cereal, water, fresh produce and poultry. Circana's basket read matches it. Fresh produce and chilled meat grew as a share of SNAP trips, while deli fell back.
The waiver states make the point sharper. Eight states blocked fizzy drinks from benefits. In those states the share of SNAP trips carrying that shelf fell nine points in a year. Spend per home dropped from $159 to $146. Of the $13 that moved, 81% went into food rather than other drinks.
The shopper has also changed store
This is the part that lands hardest on brand owners. FMI ran its 2026 shopper study in February. 37% of US shoppers now name a mass chain as their main food store, against 36% for a supermarket. Mass gained six points in a year. The two have drawn level for the first time.
Circana found mass chains take the biggest share of SNAP trips, with dollar stores next. Pure e-commerce grew SNAP spend by more than 31%, close to twice the rate seen elsewhere.
A mass chain carries a shorter shelf than a supermarket. So a brand losing units is also walking into a store with fewer slots. The tail of the range goes first.
Price has stopped working as a lever
Bain's shopper pulse says 80% of US shoppers are still trying to spend less. 28% are cutting back on food itself. Of those, 56% are trading down to cheaper brands. 49% are simply buying fewer packs, and 44% lean harder on deals.
Food prices are up 33% since 2019, so the shopper is counting. Every point of price now buys back a point of units. Circana's Sally Lyons Wyatt told the trade to build 2027 plans around a smaller, lower-benefit SNAP base. Her line was blunt. "This is really the new baseline," she said.
What operators and buyers should take from this
The useful part of this story is that it can be modelled. A slump is vague. A $10bn withdrawal with a start date, a state map and a shelf list is a forecast. A firm with heavy weight in sweets, biscuits, frozen meals or chilled deli can size its own hole this quarter.
Two moves follow from that. Price per trip matters more than price per kilo now, so entry packs and multipacks need a fresh look. And the shelf plan has to follow the shopper into mass and dollar. Slots there are fewer and own label is stronger. Any firm treating this as a dip will plan 2027 against a shopper base that has already gone.

Global Aseptic Packaging Market Report 2026
148.4bn litres and 344bn packs in 2025. Aseptic volumes across dairy, dairy alternatives, beverages and food in 39 markets — 2025 actuals and forecasts to 2030. Buy online and receive it within 24 hours.
More information
Global Cheese Database 2026
Production, imports, exports and consumption for 39 cheese types across 48 countries, with actuals through 2025 and forecasts to 2030. Join the waitlist for early access, pre-launch pricing and a free sample country chapter.
Get early accessStrategic Insights
📊 Analytics & Strategic Insight
The US shopper base got smaller by law, and the shelf moved with it
The decision most in this industry are avoiding:
👉 The base year has gone. Most 2027 plans still build off a 2025 shopper count. That count held two million homes which have since left the scheme.
👉 The hole is in the middle of the store. Teams keep planning against one US-wide number. That number hides sweets, biscuits, frozen meals and deli.
👉 Winning share can still mean losing money. Mass and dollar stores are picking up trips. They also carry fewer slots and a stronger own label.
Here's the full context:
→ 2019 to 2026: US food prices rose 33%. Shoppers took it on the chin for years.
→ July 2025: Congress passed HR 1. It changed who qualifies for SNAP food aid.
→ February 2026: The new rules took effect. Checks on them began a month later.
→ May 2026: People on SNAP fell to 36.6m, down from 42.2m a year before.
→ Most recent: Circana puts the lost EBT funds at about $10bn this year. Bain and NIQ show units down 1.8% in June.
What this means for food and beverage operators and investors:
✅ Model the loss by shelf and by state. The eight fizzy-drink waiver states show a nine point drop in trips. That is a map, so use it.
✅ Treat the channel shift as a listing risk. Mass is now the main food store for 37% of US shoppers. Slots there are fewer than in a supermarket.
✅ Watch which brands hold their non-SNAP growth. Circana found sweets and salty snacks still grew on other payment types. The shelf is splitting by wallet.
3 moves you can make this week:
1️⃣ Pull your SNAP-weighted store list. Rank your top 50 US doors by how much food aid runs through them. Most teams have never sorted it that way.
2️⃣ Price the trip before the kilo. Test your entry pack against a $146 monthly drinks budget. Then test the multipack.
3️⃣ Ask your mass buyer what drops. Fewer slots means a cut list exists already. Better to see it now.
Take the Next Step
💬 You don't need a written brief.
Tell us what you are weighing up, and we will come back with the likely project scope, recommended direction and cost range.
→ Tell us what you're planning
Zenith Consulting
Submit your food & beverage project enquiry.
Share your requirements. If there is a strong fit, we’ll come back with an indicative investment range, project timeline and recommended strategic approach.
Reviewed by Zenith Consulting’s senior food & beverage strategy team.
Related analyses
- Market & Category Growth
UK Cheese Supplies Fall 6,900 Tonnes As Exports Hit A Q2 Record: Cheddar Milk Use Down 14 Million Litres
AHDB put UK available cheese supplies down 6,900 tonnes in the second quarter of 2026, while exports rose 8,000 tonnes to an all-time quarterly high. Defra figures show milk into Cheddar down 14.1 million litres in August alone.
Read analysis → - M&A, Investment & Valuation
Parmigiano Reggiano Takes On Australian Parmesan: The EU Trade Deal Protected 53 Cheese Names And Left Parmesan Out
The Parmigiano Reggiano Consortium has opened a three-year campaign in Australia, where cheese output runs at 455,000 tonnes a year. Australia agreed to protect 53 EU cheese names, and parmesan is not one of them.
Read analysis → - M&A, Investment & Valuation
Parmigiano Reggiano Takes On Australian Parmesan: The EU Trade Deal Protected 53 Cheese Names And Left Parmesan Out
The Parmigiano Reggiano Consortium has opened a three-year campaign in Australia, where cheese output runs at 455,000 tonnes a year. Australia agreed to protect 53 EU cheese names, and parmesan is not one of them.
Read analysis →
Share it with your peers
Pass this analysis to colleagues who track the food and beverage market.
Zenith Market Intel
Need a specific food or beverage market report?
Tell us which category, region or question would be useful for your team.
Sister Publication
Also follow our Water Dispense Market Intelligence
Category analyses, operator briefings, and investor signals across the global water dispense market.