China Buys 19% More Cheese While Paying Less Per Tonne As New Zealand Supplies Most Of It
China imported 170,300 tonnes of cheese in the first nine months of 2026, while the value of those imports rose more slowly. Duty-free New Zealand cheese for pizza, bakery and milk tea chains carries the growth, and the price per tonne keeps slipping.
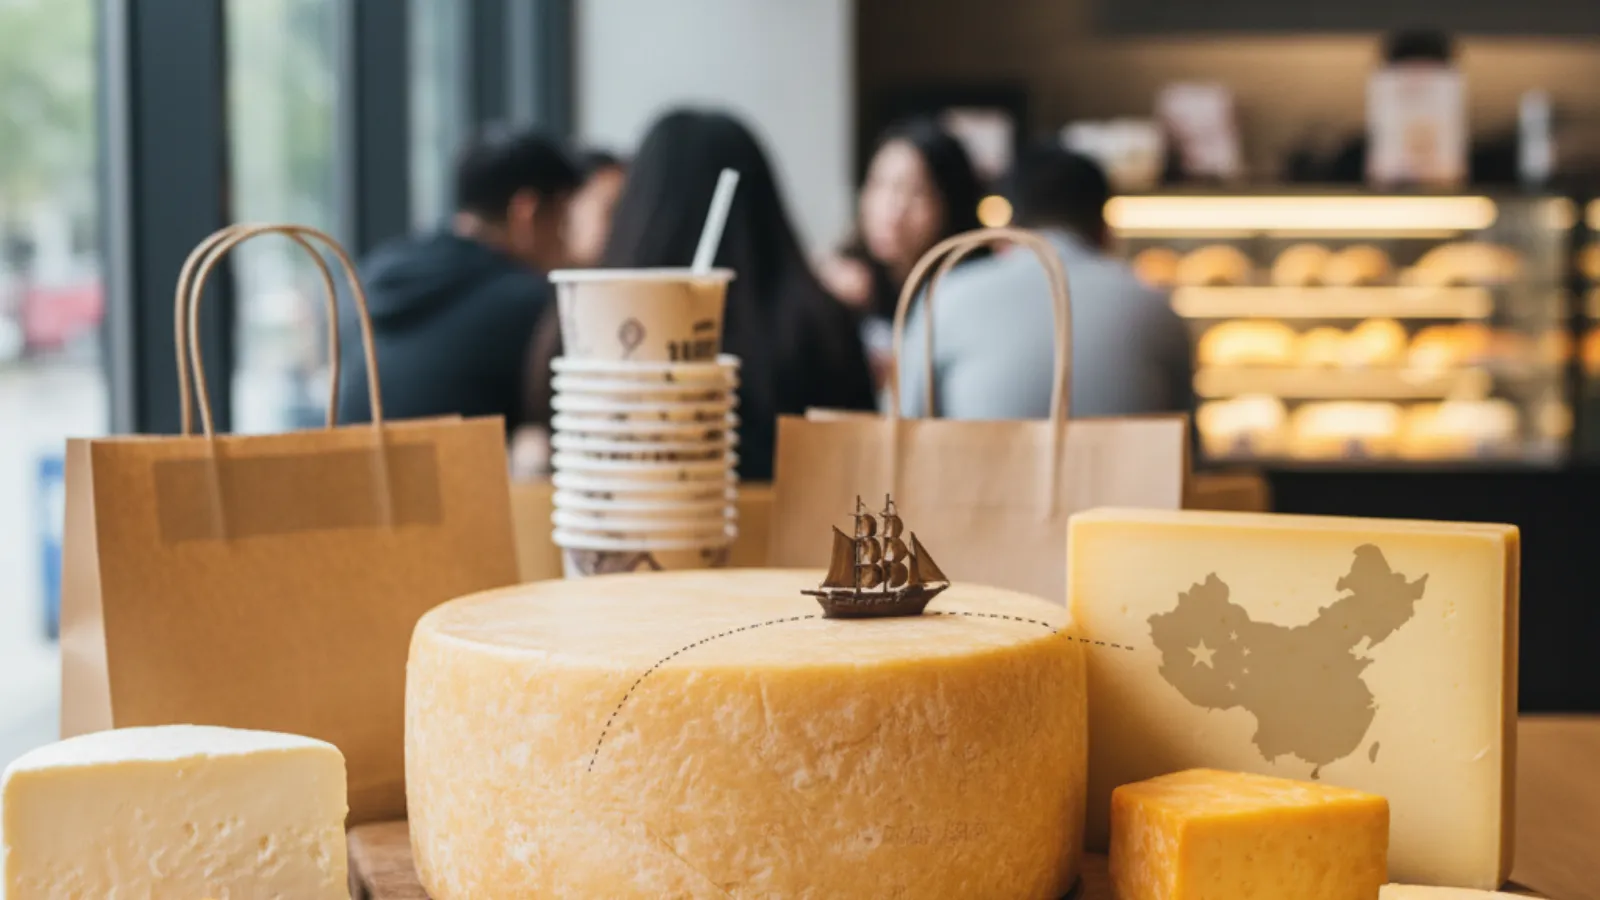
The one thing I would ask any cheese exporter's board is this. Who in China is eating the extra cheese, and at what price? China imported 170,300 tonnes of cheese in the first nine months of 2026. That was 19% more than a year earlier. The value of those imports rose more slowly. My view is that the gap between volume and value matters more than the headline.
China buys more cheese and pays less for each tonne
The figures come from the China Dairy Association's monthly trade report, built on customs data. Import value reached 916 million dollars over the nine months. Commerce ministry figures put it at about 920 million dollars. Both show the same rise of 15.9%. Volume grew faster than value. That happens because the average price paid for each tonne fell. Across the nine months it worked out at about 5,380 dollars a tonne. For the first eight months, the average was 2.7% lower than a year before. So Chinese buyers are taking more cheese and paying a little less for each tonne. That is the pattern of a market where supply chases demand. A shortage would push the price the other way.
New Zealand supplies almost two tonnes in every three
New Zealand sent 63.3% of China's cheese in the first eight months. Australia supplied 16.2%. The EU supplied 12.9%, and other origins shared what was left. Here is why New Zealand leads. Since the start of 2024, every New Zealand dairy product has entered China free of duty. Australia also ships under a free trade deal, and it is the fastest growing of the three. EU cheese still pays the normal tariff. Since February it has also paid an anti-subsidy duty of up to 11.7%. A duty gap of that size decides who wins an order placed on price. A pizza chain buying mozzarella by the container looks at the landed price first. New Zealand milk is also cheap to make in a normal season. So the duty and the milk cost point the same way.
Fresh cheese and food service carry the growth
The split by cheese type points to food service. Fresh cheese, which includes mozzarella, made up almost half of import volume in the first half. It also grew faster than the total. That matters because fresh cheese in China is mostly a cooking cheese. It goes on pizza and into baked goods. It also goes into the cheese foam on milk tea. Those are chain businesses, and chains buy to a recipe and a price. A chain with a few thousand outlets writes one cheese into its recipe. It then buys that cheese by the container, month after month. The cheese has to melt, stretch and brown the same way every time. New Zealand plants have made that kind of cheese for export for decades. The growth sits with professional buyers, and they switch suppliers when the price moves. Shoppers change their habits more slowly. Cheese is still a small part of the Chinese diet at home. A home habit takes years to build. A chain can change a menu in one season.
Growth slowed from a fast start, then picked up
The pace has cooled since spring. In the first two months, imports were up 31% on the year. By April the running total was up 29.6%. By August the rise had slowed to 18%. That happens because a running total carries every earlier month. A strong spring keeps lifting the total long after the monthly pace has eased. So a slowing total can hide a market that is still adding tonnes. September then picked up again. The gap between the August and September totals points to about 18,200 tonnes for the month. That is roughly 28% more than China bought in September last year. One month does not make a trend. But it does show demand did not stall in the third quarter.
What it means for China's own cheese makers
China's own cheese makers are growing too, from a small base. Miaokelando is the leading local cheese brand. At the Shanghai import fair it signed a deal with Charoen Pokphand to sell cheese into Thailand. Much of China's processed cheese is made from imported natural cheese. The mechanism is simple. A local plant buys cheddar or gouda in bulk. It melts the cheese with other dairy ingredients. Then it packs the result as sticks or slices. So part of the rise in imports feeds local brands. It does not compete with them. For an exporter, that local melt plant is a customer as well as a rival. Imported cheese wins most clearly in fresh cheese for food service. Zenith's Global Cheese Database 2026 shows processed cheese slowing to under 1% a year to 2030 across its 48 markets. Fresh cheese, mozzarella included, grows fastest. That mix favours the exporter over the local melt plant.
The Zenith read: fast import growth with soft prices into 2027
We think China's cheese imports keep growing above 10% a year into 2027. The evidence is the September month and the mix of buyers. Food service chains are still adding cheese to their menus. New Zealand has the duty-free access and the milk to supply them. That matters because it keeps the landed price low. A low price widens the use of cheese, which lifts volume again. So we expect volume to keep beating value, with the price per tonne flat or a little lower. Zenith's database puts China among five Asian markets where cheese grows above 5% a year. We expect imports to grow faster than the market itself. The figure that would change our call is New Zealand's share. If it falls below 60%, other suppliers are winning on price.
The trade figures show the size of the rise. They cannot show how much of it is new demand. Some imports may simply replace local cheese, or feed local melt plants. Our Global Cheese Database 2026 splits China's production, imports and consumption by cheese type in tonnes, with forecasts to 2030.
Going deeper on this market? See the Global Cheese Database 2026.

Global Water Database 2026
Packaged, bulk, flavoured and premium water in 86 markets, to 2030.
More information
Global Cheese Database 2026
Production, imports, exports and consumption for 39 cheese types across 48 countries, with actuals through 2025 and forecasts to 2030. Buy one market or any five with a single-user, departmental or corporate licence, or get your free database and report sample first.
Get your free database & report sampleStrategic Insights
📊 Analytics & Strategic Insight
China pays less for each tonne as it buys more cheese
The decision most in this industry are avoiding:
👉 The headline growth flatters the exporter's margin. Value rose more slowly than volume all year. In August alone, the price per tonne was 4.7% lower than a year before.
👉 China is swapping powder for cheese in its import bill. Skim milk powder imports fell 26% in the first two months. Local milk now covers powder. Cheese still comes from abroad.
👉 The EU duty has cost less volume than many expected. EU cheese shipments still rose 11.3% to August. Buyers who need a named origin pay the duty and stay.
Here's the full context:
→ 2024: New Zealand dairy enters China free of duty from January.
→ 2025: China sets provisional duties of up to 43% on selected EU dairy in December.
→ February: Final duties land at up to 11.7%, mostly on fresh and processed cheese.
→ April: China's cheese imports for the year so far run 29.6% ahead.
→ Most recent: Imports reach 170,300 tonnes in nine months. That is 19% more than a year earlier.
What this means for cheese producers, traders and buyers:
✅ The export sales desk should price China on landed cost per tonne. New Zealand's 96,200 tonnes to August set the price every rival is quoted against.
✅ The food service account manager should sell direct to the big chains. Chains set recipes centrally. One approval can move a whole year of orders.
✅ The Australian supply planner has room to grow. Australian shipments rose 22.7% to August, faster than any other origin.
What this means for market decisions:
1️⃣ China is one of the few large cheese markets still adding volume at speed. Its imports were worth 815 million dollars in the first eight months.
2️⃣ New Zealand's duty-free position is hard to attack on price. A supplier without a trade deal needs a cheese New Zealand does not make in volume.
3️⃣ An entrant should test fresh cheese for chains first. Zenith expects fresh cheese to grow about 2.4% a year to 2030, faster than any other type.
The Zenith view:
This proves China's cheese demand is still growing fast through trade. It does not prove the growth pays exporters well, because the price per tonne keeps slipping. The figure that settles it is the full-year price per tonne in early 2027 trade data. If it ends above the 2025 level, exporters have pricing power again.
The data behind this story
🧀 Global Cheese Database 2026
Production, imports, exports and consumption for 39 cheese types across 48 countries, in tonnes, with actuals to 2025 and forecasts to 2030. Country workbook plus market insights dossier, delivered by Akos Petri, with a free sample country chapter on the page.
→ See the database
Weighing a cheese export move into China or Southeast Asia? Zenith helps food and beverage companies assess market size, growth, competitors, pricing and route to market before they invest.
→ Discuss your market
Zenith Consulting
Submit your food & beverage project enquiry.
Share your requirements. If there is a strong fit, we’ll come back with an indicative investment range, project timeline and recommended strategic approach.
Reviewed by Zenith Consulting’s senior food & beverage strategy team.
Our market reports
All reports and databases Available now
Global Aseptic Packaging Market Report 2026
39 markets, 2025 actuals and forecasts to 2030 by category, region and pack type.
View report Available now
Global Cheese Database 2026
48 markets and 39 cheese types: production, trade and consumption to 2030.
View report Available now
UK Water Drinks Reports 2026
Plain, flavoured and functional water in the UK: companies, brands, own label and forecasts to 2030.
View report- Available now
Global Water Database 2026
Packaged, bulk, flavoured and premium water in 86 markets, to 2030.
View report  Available now
Global Premium Bottled Water Report 2026
Premium water volume, value and brands, with six country deep dives.
View report Available now
Global Water Dispense Market Reports 2026
Coolers, dispensers and operators across 35+ markets, with forecasts to 2030.
View report- Free tool
Cheese Market Sizer
Size any of 48 cheese markets: 2025 consumption, kg per person, your market share and headroom.
Open free tool
Related analyses
- Health, Nutrition & Functional
Nippon Dynawave Restarts Longview Pulp But Not Carton Board As A 21 Billion Yen Loss Tests Aseptic Carton Supply
Nippon Paper will restart pulp at its Longview mill in December, but the machines that make liquid packaging board still have no start date. For aseptic carton buyers in North America and Japan, that gap matters more than the headline restart.
Read analysis → - Market & Category Growth
UK Cheese Supplies Fall 6,900 Tonnes As Exports Hit A Q2 Record: Cheddar Milk Use Down 14 Million Litres
AHDB put UK available cheese supplies down 6,900 tonnes in the second quarter of 2026, while exports rose 8,000 tonnes to an all-time quarterly high. Defra figures show milk into Cheddar down 14.1 million litres in August alone.
Read analysis → - Corporate Strategy & Portfolio
Elopak Says Aseptic Carton Board Supply Stays Tight Into 2027 After The Longview Mill Shutdown
Elopak told the market its board supply stays tight into 2027 after the Longview mill stopped. Cartons carry 66.5% of world aseptic volume, so one paper mill can set the ceiling for a whole trade.
Read analysis →
Share it with your peers
Pass this analysis to colleagues who track the food and beverage market.
Zenith Market Intel
Need a specific food or beverage market report?
Tell us which category, region or question would be useful for your team.
Sister Publication
Also follow our Water Dispense Market Intelligence
Category analyses, operator briefings, and investor signals across the global water dispense market.