US Cheese Ships At $2.01 A Pound And Lands At $4.10: USTR Opens Its Trade Barrier List To Cheese Exporters
US cheese exports hit a record 143.6 million pounds in July and 943.7 million pounds in the seven months to July. USTR has opened its annual barrier list until 29 October, and the buckets that cost cheese volume are not the tariff ones.
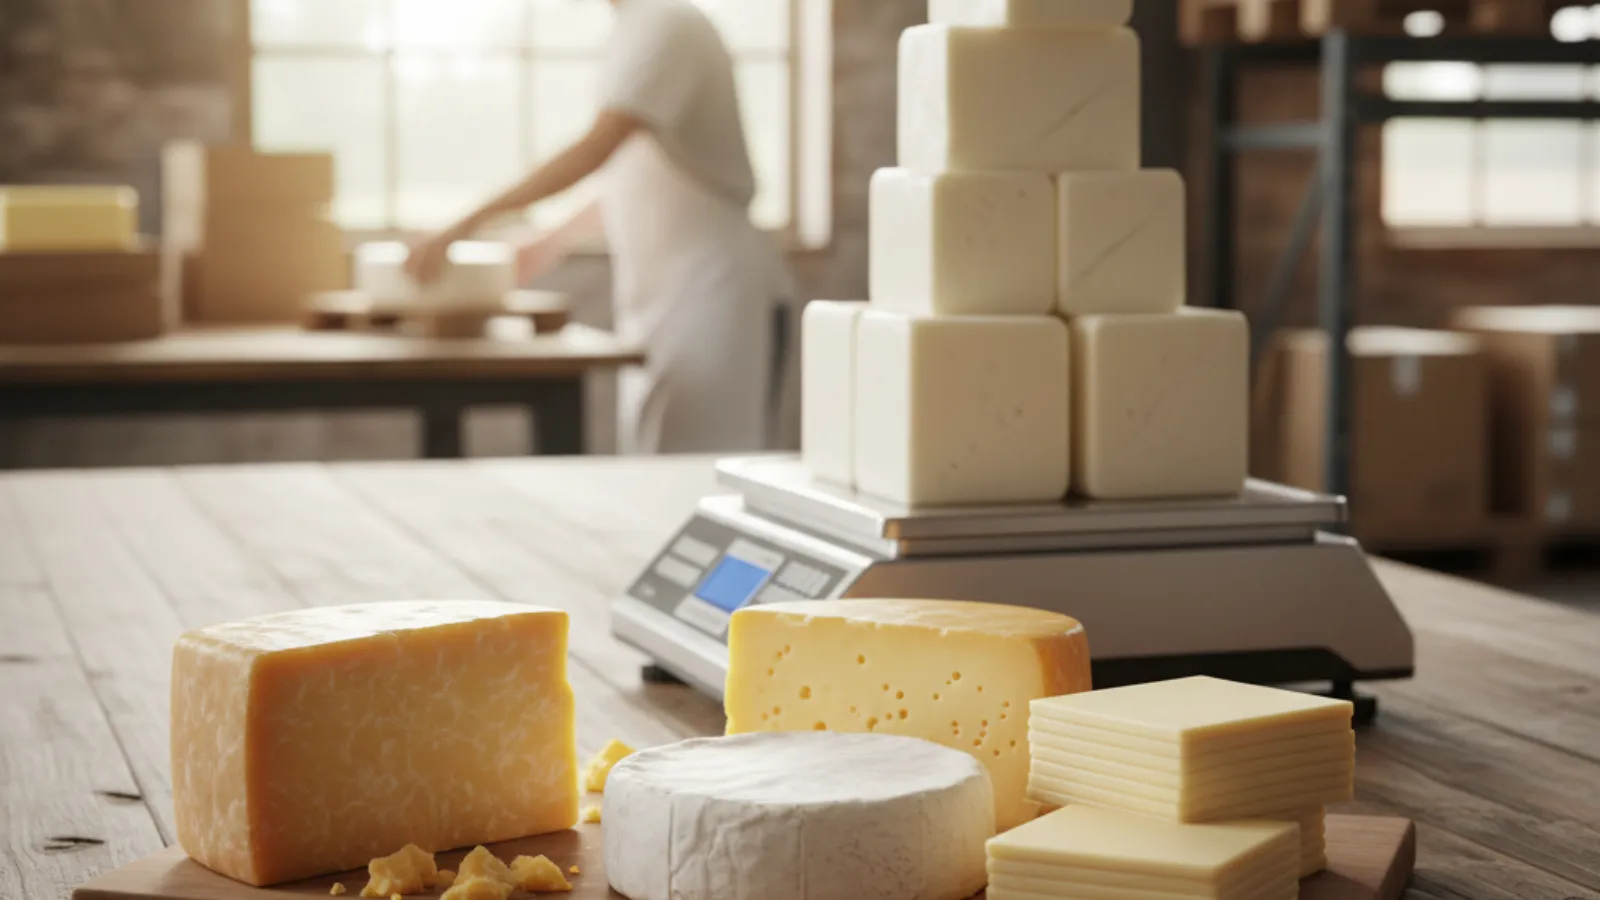
The one question I keep putting to cheese exporters is this. Which barrier actually costs you tonnes? Washington opened the window to answer it on 18 September. The Office of the United States Trade Representative asked exporters a direct question. Name the foreign rules that block your goods.
What Washington asked for
The comments feed the yearly report on foreign trade barriers. The docket is USTR-2026-0498 and comments close on 29 October 2026. USTR set out five buckets for exporters to fill. Import policies, covering duties, quotas, licences and customs practice. Technical barriers, covering standards, labelling and testing. Sanitary and plant health rules. Intellectual property. Subsidies.
Only the first bucket is about money at the border. The other four are about whether the product can be sold at all.
A record year for cheese
US cheese exports are at a record. July shipments came to 143.6 million pounds, a quarter more than a year earlier. That beat the record set in June, 142.1 million pounds. Five straight months have now cleared 135 million pounds. The seven months to July came to 943.7 million pounds, up 24%. USDA published the figures on 4 September.
Where the cheese goes
Nine markets take most of it. Mexico led with 321.1 million pounds, up 32%. South Korea took 130.8 million pounds, up 36%. Then Japan at 87.2 million and Australia at 59.6 million. Saudi Arabia grew fastest of the nine, up 45% to 24.1 million pounds. Guatemala, Chile, the Dominican Republic and Panama fill out the list. Not one European market appears on it.
The price gap in the data
The two flows do not price the same. Those 943.7 million pounds earned $1.9 billion. That works out at about $2.01 a pound. US cheese imports over the same seven months came to 251.3 million pounds. They cost $1.03 billion, or about $4.10 a pound. America ships cheese out at half what it pays to bring cheese in. Italy alone sent 53.8 million pounds, up 24%.
Export volume rose 24% while export value rose 12%. The dollar a pound fell while the tonnage climbed. That is what winning share on price looks like in a trade table.
Names sit in the list
One of the five buckets is intellectual property. Cheese names live there. The National Milk Producers Federation says the EU uses origin rules to lock up common cheese terms. It names parmesan, asiago, gorgonzola and feta. A duty raises your price, while a name rule takes your product off the shelf. Lawmakers from both parties reintroduced the SAFETY Act in April 2025 to defend those terms in trade talks.
What exporters should do
Treat the October window as a commercial task. List the markets where your cheese is priced out by duty. List the ones where it cannot carry its own name. Those are two different problems with two different fixes. Price barriers move with a trade deal. Name barriers move with a legal text and a much longer clock. Then check whether your 2026 destination map is the market or just the part of it you are allowed into.
This also raises a wider question around how much cheese actually reaches each market, and in which type. That is one of the areas we track across cheese markets in our 2026 research. The Global Cheese Database 2026 builds every trade flow from HS 0406 customs data. It runs to 39 cheese types across 48 markets, in tonnes. A waitlist is open, with a free sample country chapter.
Global Aseptic Packaging Market Report 2026
148.4bn litres and 344bn packs in 2025. Aseptic volumes across dairy, dairy alternatives, beverages and food in 39 markets — 2025 actuals and forecasts to 2030. Buy online and receive it within 24 hours.
More information
Global Cheese Database 2026
Production, imports, exports and consumption for 39 cheese types across 48 countries, with actuals through 2025 and forecasts to 2030. Join the waitlist for early access, pre-launch pricing and a free sample country chapter.
Get early accessStrategic Insights
📊 Analytics & Strategic Insight
The barrier that costs you volume is rarely the one on the tariff schedule
The decision most in this industry are avoiding:
👉 Your export map is a barrier map you did not draw. Nine markets take almost all US cheese, and every one of them is open. The gaps are not where demand is weak. They are where a rule sits.
👉 A name is a trade barrier with no number on it. A duty shows up in your landed cost model. A term you cannot print never reaches the model at all, because the launch is dropped first.
👉 Record tonnage can hide a falling price. Volume rose 24% and value rose 12% in the same seven months. Half that growth was bought rather than won.
Here''s the full context:
→ April 2025: Lawmakers from both parties reintroduced the SAFETY Act to defend common cheese names abroad.
→ May 2026: US dairy groups told USTR that spare cheese capacity in other countries was distorting trade.
→ June 2026: US cheese exports set a monthly record at 142.1 million pounds.
→ 4 September 2026: USDA published July trade. Cheese exports broke the record again at 143.6 million pounds.
→ Most recent: USTR opened its barrier list on 18 September. Comments close on 29 October.
What this means for cheese producers, traders and buyers:
✅ Split your blocked markets into two lists. One list moves with tariffs and trade deals. The other moves with labelling law, and it moves far more slowly.
✅ Price your import competition per pound rather than per shipment. European cheese lands in America at roughly double the dollar a pound US cheese leaves at. That gap is the premium a protected name earns.
✅ Growth at 24% volume and 12% value is a margin question. Check whether your export book is adding tonnes or adding profit. In 2026 those are not the same trade.
3 moves you can make this week:
1️⃣ Pull your own volume and value by market. Work out the dollar a pound for each one. Rank them, and look at what sits at the bottom.
2️⃣ List every market where a product name has to change. Put a tonnage estimate next to each. That number is your case for the October filing.
3️⃣ Ask one buyer in a blocked market what they would take. A real order beats an estimate. It also tells you which cheese type the barrier is really costing you.
The data behind this story
🧀 Global Cheese Database 2026
Production, imports, exports and consumption for 39 cheese types across 48 countries, in tonnes, with actuals to 2025 and forecasts to 2030. The 2026 edition is being built market by market. Waitlist members get the pre-launch price and a free sample country chapter.
→ Join the waitlist
Zenith Consulting
Submit your food & beverage project enquiry.
Share your requirements. If there is a strong fit, we’ll come back with an indicative investment range, project timeline and recommended strategic approach.
Reviewed by Zenith Consulting’s senior food & beverage strategy team.
Related analyses
- Market & Category Growth
US Cheese Warning Labels Move Closer: Bongards Adds 180 Million Pounds Of Process Cheese Anyway
A US Senate committee has advanced a bill that would put a front-of-pack warning on whole milk, all cheese and most yogurt. Bongards is still spending $135 million on 180 million pounds more process cheese, and the channel split explains why.
Read analysis → - Market & Category Growth
Tetra Pak Takes Tetra Recart Into Chinese Dessert Soups: World Aseptic Food Is Stuck At 8.3 Billion Litres
Tetra Pak and Shanghai Meilin have put two ready-to-eat dessert soups into Tetra Recart, a carton that is sterilised after filling rather than aseptically filled. Zenith's Global Aseptic Packaging Market Report 2026 puts world aseptic food at 8,286 million litres in 2025, 5.6% of world aseptic volume, and flat to 2030.
Read analysis → - Market & Category Growth
Foremost Farms Exits 40lb Block Cheese: $13 Billion Of New US Dairy Capacity Is Closing Old Cheddar Lines
Foremost Farms will close its Marshfield, Wisconsin cheese plant in December and stop making 40lb block cheddar, and it names new US cheese capacity as a reason. With $13 billion of dairy plants under way and blocks trading below barrels, the old bulk line is the first casualty.
Read analysis →
Share it with your peers
Pass this analysis to colleagues who track the food and beverage market.
Zenith Market Intel
Need a specific food or beverage market report?
Tell us which category, region or question would be useful for your team.
Sister Publication
Also follow our Water Dispense Market Intelligence
Category analyses, operator briefings, and investor signals across the global water dispense market.