Cheddar Rises 8.6% At Global Dairy Trade While Butter Falls: The Milk Price Behind It Does Not Count Cheese
Cheddar closed the 3 November Global Dairy Trade sale at 3,970 dollars a tonne, up 8.6%, while butter and milkfat both fell. New Zealand's farmgate milk price is built from powder and fat and excludes cheese, so the gain lands on whoever already owns cheese capacity.
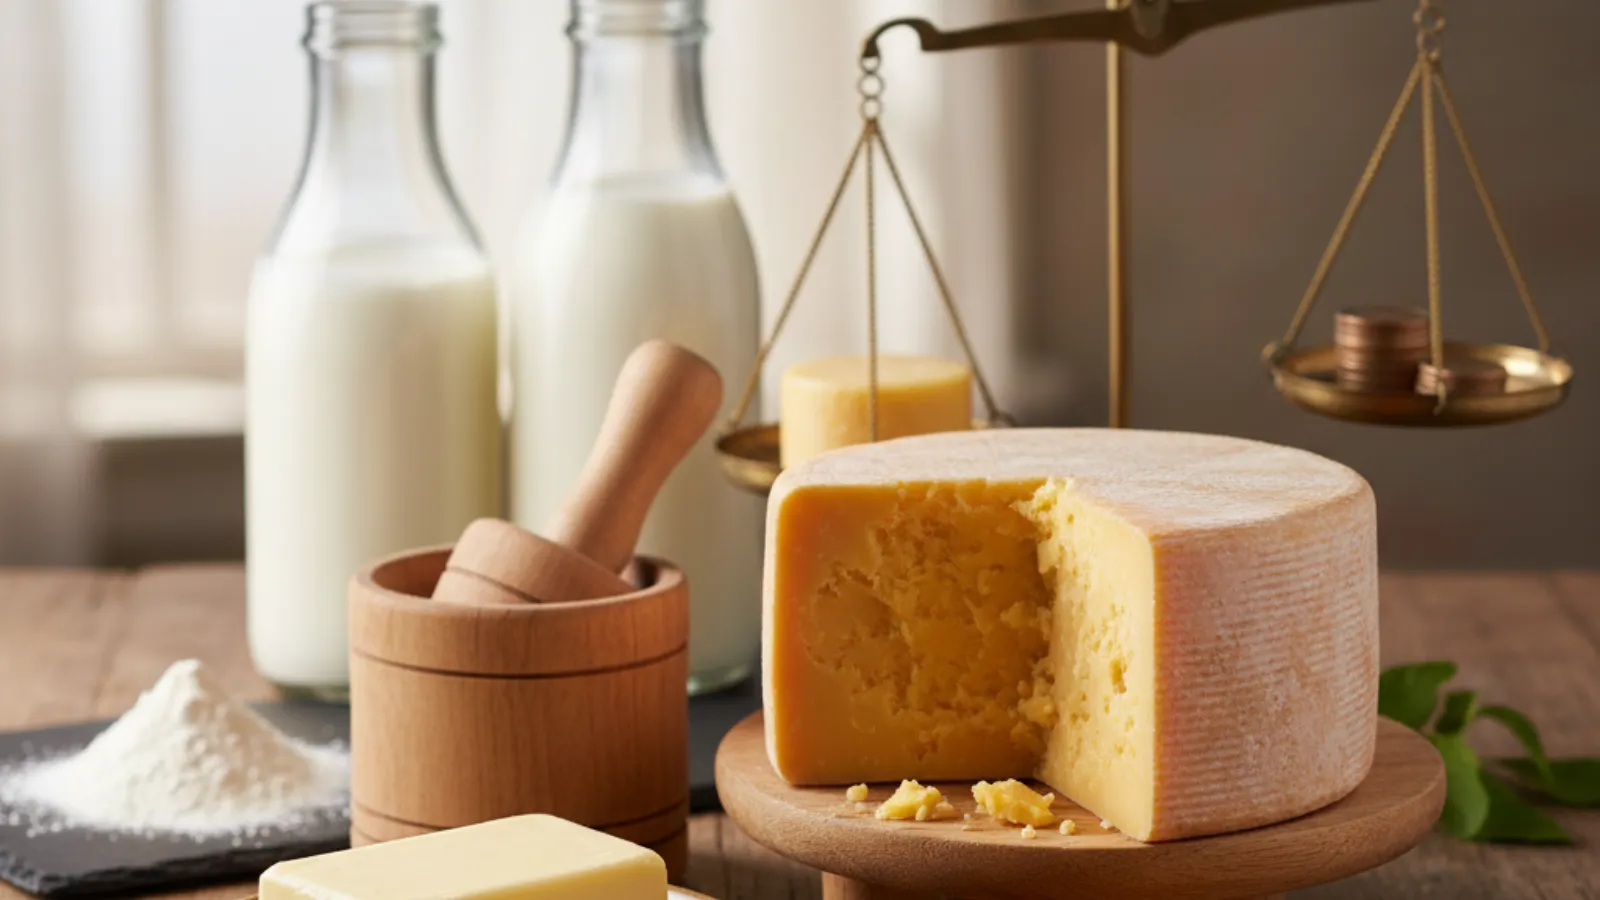
The one thing I keep asking cheese buyers is simple. Which line do you actually price from? Most of them watch the headline dairy index. That index rose 3.0% at the sale on 3 November. Cheddar rose 8.6%.
What the November sale actually printed
Global Dairy Trade held its sale on 3 November. Cheddar closed at 3,970 dollars a tonne, up 8.6% on the previous sale. Mozzarella rose 5.8%. Buyers took 39,806 tonnes across every product on the platform. That matters because this platform is not a spot market. Bidders were buying contracts for delivery between December and May. So the price sets what sellers will commit before the milk is collected. A buyer who reads it as this week's cheese price reads it wrong. It is next season's price, agreed now. That distinction changes who should care today. A trader covering a January shipment has just been repriced. A plant quoting a twelve month retail contract has not been, yet. Both cheeses on the platform moved the same way. Cheddar and mozzarella leave the same milk pool in the same week. When both rise, the cause usually sits in the milk rather than in one lane or one plant.
Every milkfat line went the other way
Fat did the opposite. Butter closed at 4,503 dollars a tonne, down 4.7%. Anhydrous milkfat fell 3.2% to 5,306 dollars a tonne. NZX blamed heavy supply from Europe, the United States, Argentina and New Zealand. The reason is worth stating plainly. Fat is the one dairy stream four large exporters can all lift in the same season. A churn is cheap to run and quick to fill. Spare cream finds a churn within days. Cheese does not work that way. A new cheese vat takes years to build. A cheese room also needs brine, ripening space and skilled people. So a fat surplus arrives inside a quarter. A cheese shortage takes seasons to repair. That difference in speed is why the two lines can part company for months.
Why that widens a cheese margin
Put the two moves side by side. A cheese plant gains twice over on the same sale. That happens because a cheddar vat buys two things and sells two things. It buys fat and protein in the milk it takes in. It sells cheese and whey out the other end. Cheaper fat lowers the cost of one of those inputs. A dearer cheese lifts the value of the main output. So the gap between cost and return widens from both ends at once. A butter and powder plant gets the mirror image of that. Its main output is the line that fell this week. Its co-product, skim powder, held up instead. The same milk, split two ways, now pays very differently. That split is the whole commercial content of this sale. It is also the reason a blended dairy index tells a cheese maker almost nothing.
The milk price behind it does not count cheese
Here is the part the coverage left out. Fonterra lifted its forecast milk price midpoint on 30 October to 9.75 New Zealand dollars a kilo of milk solids. The old midpoint was 9.50 New Zealand dollars. Chief executive Richard Allen named whole milk powder and skim milk powder as the cause. He did not mention cheese once. The reason sits in the rules rather than in the market. Fonterra's milk price manual builds the price from five reference products. Those are whole milk powder, skim milk powder, butter, anhydrous milkfat and buttermilk powder. The manual states that the method excludes returns from non-powder commodities such as cheese and casein. So a cheddar rally cannot reach the farmgate at all. It sits outside the basket by design. New Zealand farmers get paid for powder and fat whatever cheddar does next.
So the gain lands on whoever already has the vats
A price signal only changes behaviour where somebody can act on it. The New Zealand milk price is built from powder and fat, so a cheese rise sends nothing to the farm. It sends nothing to the plant manager either. That happens because the co-op pays its members the same for milk whatever it makes from that milk. The make decision then turns on what each plant can physically run. Capacity decides who captures a cheese rally, rather than the week's cheese price. Northern hemisphere cheddar plants sit in a different position entirely. A Wisconsin or Irish cheddar plant is a fixed cheese asset. The milk has nowhere else to go once it arrives. So that plant takes the whole price move into its own margin. Zenith's cheese forecasts place more than 40% of all new volume to 2030 in two markets. Those are the EU27 and the United States. Both of them already have the cheese rooms built.
The Zenith read on where this price goes
We think the cheese lines hold most of this 8.6% gain into the December contract while fat keeps sliding. The reason is the shape of the two supply bases. Fat output can be raised by four exporters inside one season. Cheese output cannot be raised that fast anywhere. The figure that would change our call is the American cheddar print. United States September cheese production is published on 5 November. A return to growth in cheddar output would push fresh supply into the export pool within a quarter. Flat or falling cheddar output would leave this rally standing. Our opening claim settles here. The headline dairy index is a fat and powder index wearing a dairy name. A cheese buyer who prices from it is pricing somebody else's market. Price from the cheddar line instead. Then check who is actually allowed to make more of it.
One caution belongs with any auction print. A fortnightly sale measures what sellers chose to offer and what buyers chose to take. It does not measure what the world ate. Two sales in a row pointing the same way carry far more weight than one. The sale that follows this one is the real test of the move.
This also raises a wider issue around where cheese demand growth actually sits. That is one of the areas we track across cheese markets in our 2026 research. Our Global Cheese Database 2026 holds production, imports, exports and consumption for 39 cheese types across 48 countries. Every figure is in tonnes. Actuals run to 2025 and forecasts run to 2030.
Going deeper on this market? See the Global Cheese Database 2026.
Cheese Market Sizer
Size any of 48 cheese markets: 2025 consumption, kg per person, your market share and headroom.
Open free tool
Global Cheese Database 2026
Production, imports, exports and consumption for 39 cheese types across 48 countries, with actuals through 2025 and forecasts to 2030. Buy one market or any five with a single-user, departmental or corporate licence, or get your free database and report sample first.
Get your free database & report sampleStrategic Insights
📊 Analytics & Strategic Insight
A cheese rally that cannot reach the farm is a margin event for the people who already own the vats
The decision most in this industry are avoiding:
👉 Buyer concentration is the risk in this print, rather than the price itself. China took 59% of the offering at this sale. A move built on one buying region can unwind as fast as it arrived.
👉 Wide attention and narrow buying is what a short market looks like. There were 166 qualified bidders and only 111 of them won anything. More people watching and fewer people filling is a seller's sale.
👉 The markets that will grow cheese demand are barely at this auction. Zenith has India, Indonesia, China, Vietnam and Thailand each growing above 5% a year. Only one of those buys cheddar in volume on a fortnightly platform.
Here's the full context:
→ 1 September 2026: Cheddar fell 6.6% at the first sale of the month, closing at 3,503 dollars a tonne.
→ 15 September 2026: Cheddar jumped 16.5% at the next sale while mozzarella fell 6.0%.
→ October 2026: New Zealand reported record milk collections for the season to date.
→ 30 October 2026: Fonterra lifted its forecast milk price midpoint to 9.75 New Zealand dollars a kilo of milk solids.
→ Most recent: The index rose 3.0%, its biggest gain since February. Cheddar rose 8.6% and every fat line fell.
What this means for cheese producers, traders and buyers:
✅ The trade desk has a hedging window open right now. The sale priced December through May, so forward cover can be taken against a published curve. Waiting for a spot print wastes that window.
✅ The plant scheduler at a dual-product site has an easy call this month. Milk sent to cheese earns more than milk sent to a churn. Check the ripening and brine space before promising the extra tonnage.
✅ The cheese buyer at a foodservice group should read the whole sale rather than the index alone. The all-product average was 4,166 dollars a tonne, which hides the spread between cheese and fat. A blended figure will under-cost a cheddar contract.
What this means for market decisions:
1️⃣ Export cheese looks more attractive this quarter than export butter does. Powder lifted the milk price while cheese lifted the margin above it. That gap is the thing worth measuring, market by market.
2️⃣ Fixed cheese assets in Europe and North America win this round. They cannot switch out of cheese and they do not need to. Flexible powder and butter sites gain nothing from a cheddar rise.
3️⃣ Anyone sizing a cheese investment should test the milk pricing rule before the price forecast. A country whose milk price ignores cheese will not send milk to cheese on a price signal. Capacity moves that volume rather than price.
The Zenith view:
This proves export cheese is being bid up while milkfat is being sold down. It does not prove cheese output will follow. The milk price in the biggest exporting system does not reward cheese at all. The figure that settles it is cheddar output in the countries whose plants cannot switch. Watch the American and Irish prints rather than the auction, and watch them over two quarters rather than one.
The data behind this story
🧀 Global Cheese Database 2026
Production, imports, exports and consumption for 39 cheese types across 48 countries, in tonnes, with actuals to 2025 and forecasts to 2030. Country workbook plus market insights dossier, delivered by Akos Petri, with a free sample country chapter on the page.
→ See the database
Assessing a cheese market or a dairy investment? Zenith helps food and beverage companies assess market size, growth, competitors, pricing and route to market before they invest.
→ Discuss your market
Zenith Consulting
Submit your food & beverage project enquiry.
Share your requirements. If there is a strong fit, we’ll come back with an indicative investment range, project timeline and recommended strategic approach.
Reviewed by Zenith Consulting’s senior food & beverage strategy team.
Our market reports
All reports and databases Available now
Global Aseptic Packaging Market Report 2026
39 markets, 2025 actuals and forecasts to 2030 by category, region and pack type.
View report- Available now
Global Cheese Database 2026
48 markets and 39 cheese types: production, trade and consumption to 2030.
View report  Available now
UK Water Drinks Reports 2026
Plain, flavoured and functional water in the UK: companies, brands, own label and forecasts to 2030.
View report Register interest
Global Water Database 2026
Packaged, bulk, flavoured and premium water in 86 markets, to 2030.
View report Register interest
Global Premium Bottled Water Report 2026
Premium water volume, value and brands, with six country deep dives.
View report Available now
Global Water Dispense Market Reports 2026
Coolers, dispensers and operators across 35+ markets, with forecasts to 2030.
View report- Free tool
Cheese Market Sizer
Size any of 48 cheese markets: 2025 consumption, kg per person, your market share and headroom.
Open free tool
Related analyses
- Health, Nutrition & Functional
SIG And LSDH Take The Aluminium-Free Aseptic Carton Into French Juice Filling At A 19% Carbon Saving
SIG's aluminium-free full barrier carton has gone into commercial aseptic filling at LSDH's JFA site in Alsace, with first packs due on shelf before the end of 2026. The French carbon study reads 19%, against 29% on a German juice pack and up to 61% in SIG's headline figure.
Read analysis → - Corporate Strategy & Portfolio
Elopak's European Aseptic And Fresh Carton Sales Rose 10.7% While America Stood Still On Rationed Board
Elopak's European carton sales rose 10.7% in the third quarter while its American carton line held flat at EUR 85.5m. Rationed board, rather than weak demand, set the American number, and that changes how a carton market should be read.
Read analysis → - Corporate Strategy & Portfolio
Britain Reopens French Raw Milk Cheese Imports After 16 Months While Italy And Spain Stay Shut
Defra cleared France's entry on its dairy import list on 26 October, 16 months after raw cow milk cheese was suspended. Italian and Spanish raw milk cheese is still shut out, and the growing end of the British cheese shelf is the part that feels it.
Read analysis →
Share it with your peers
Pass this analysis to colleagues who track the food and beverage market.
Zenith Market Intel
Need a specific food or beverage market report?
Tell us which category, region or question would be useful for your team.
Sister Publication
Also follow our Water Dispense Market Intelligence
Category analyses, operator briefings, and investor signals across the global water dispense market.