Cheese Gets $3.76 Billion Of A $15 Billion US Dairy Build-Out While Milk And Cream Take $5.63 Billion
United States dairy firms are building more than $15 billion of new plant capacity across 23 states. Cheese holds $3.76 billion of it, and milk and cream have overtaken cheese at $5.63 billion.
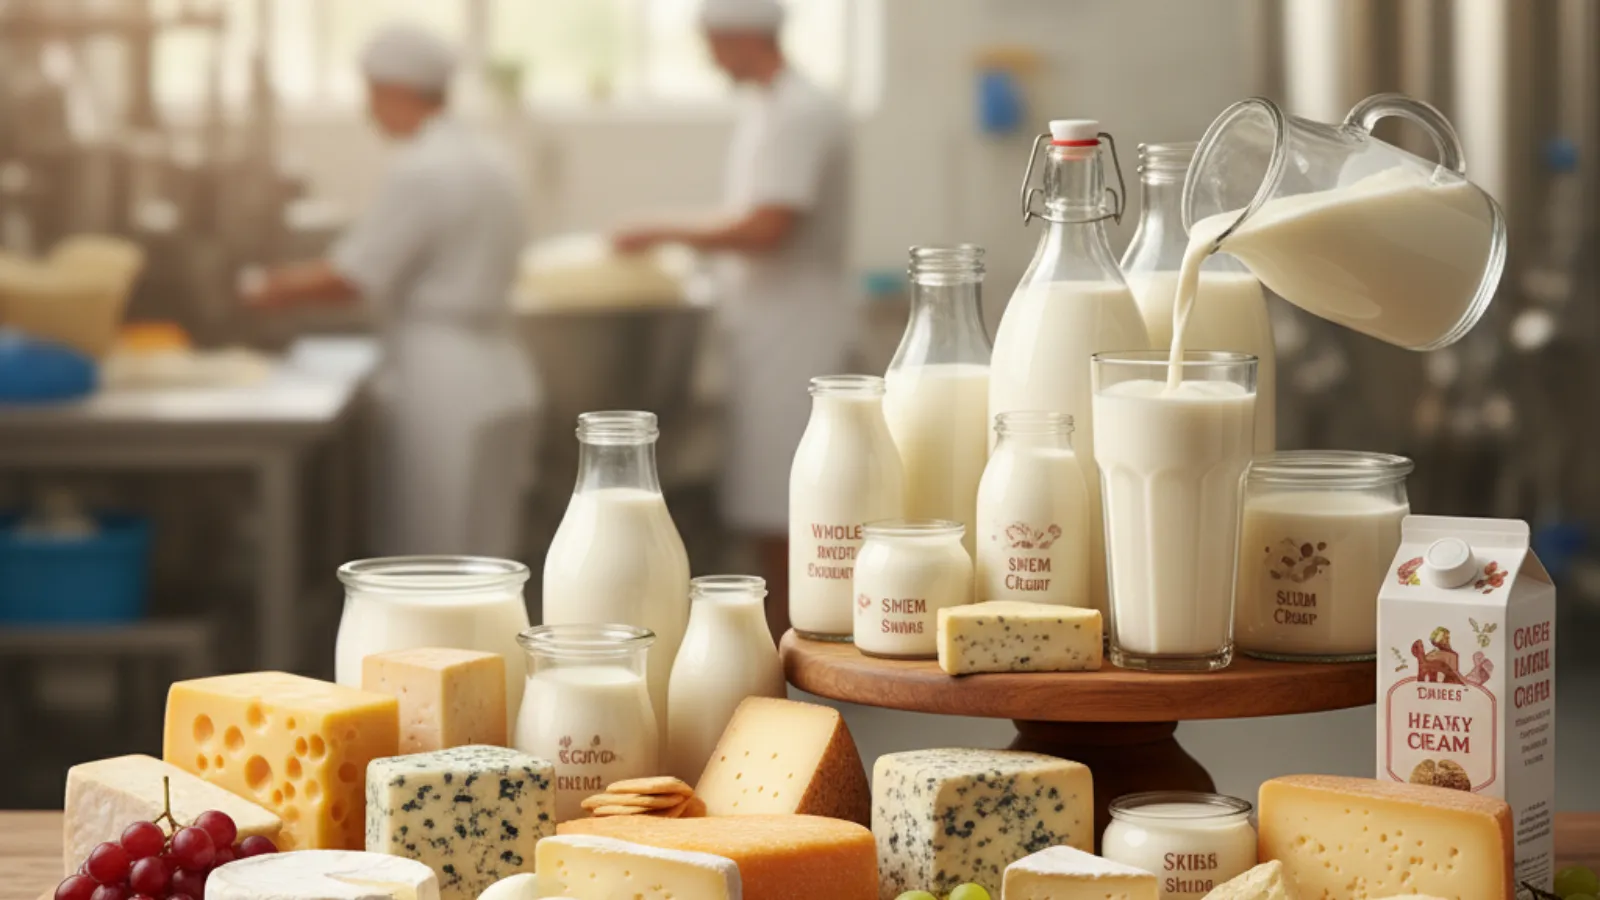
I keep seeing the same mistake in capacity numbers. People read the total and skip the split. The new United States dairy plant pipeline is worth more than $15 billion. Cheese holds $3.76 billion of it.
What the count says
The International Dairy Foods Association published the figure on 20 October 2026. It covers more than 85 projects across 23 states. All of them are planned or under way through 2030. Milk and cream take the largest share at $5.63 billion.
Cheese is second at $3.76 billion. Yogurt and cultured dairy take $3.07 billion. Butter and powders take $1.86 billion. Ice cream takes $745 million. New York leads the states at $2.8 billion. Texas follows at $1.7 billion and Wisconsin at $1.4 billion.
The base being added to is large. The United States has about 1,200 dairy plants. They draw on close to 24,000 farms. Plant output is forecast to rise from $138.5 billion in 2025 to $179 billion by 2035. Jobs in dairy plants are forecast to grow 5.6% over the same ten years.
A year ago cheese led the list
The same trade body counted $11 billion a year earlier, on 2 October 2025. That count ran to 19 states and more than 50 projects. Cheese led the groups in it at $3.20 billion. Milk and cream sat behind at $2.97 billion.
So the pipeline grew by about $4 billion in a year. Cheese took $560 million of that and milk and cream took $2.66 billion. The cheese share fell from 29% to 25%. Milk and cream rose from 27% to 37%.
Where the extra milk is going
One firm shows the shift plainly. Fairlife opened a $650 million plant at Webster in New York. Governor Kathy Hochul marked the ramp up on 20 August 2026. The site runs to 745,000 square feet. It takes 5 to 6 million pounds of milk a day and makes filtered milk and protein shakes.
The same firm broke ground at Coopersville in Michigan on 5 August 2026. That build is worth $650 million and adds two lines. It will take a further 4 million pounds of milk a day from Michigan farms. Completion is set for early 2028.
What that milk would have made
Put the two sites together and the new intake runs to 9 or 10 million pounds a day. Use the usual ten to one rule. That is about 330 to 365 million pounds of cheese a year. None of it will be cheese. Milk bought for a protein shake is milk a cheese vat did not get.
The milk itself is coming. The same trade body expects United States output to grow by 15 billion pounds by 2030. So the contest is over where that milk lands. Cheese plants now bid against filtered milk, protein and yogurt lines for the same tankers.
Cheese output is already growing slowly
United States cheese output reached 1,245 million pounds in August 2026. That is a rise of 1.4% on August 2025. Italian types grew 3.7% and mozzarella 1.8%. Cheddar fell 0.9% and so did American types as a whole.
The market tone matches. USDA reported cheddar stocks ample in the Central region in the week to 16 October. Western plants were running full and cheese was long. Export demand was softening on freight costs and lower United States prices. Cold storage cheese stocks rose about 2% in the first twelve days of October.
What this means for the market
Read the dollar total as a milk handling number rather than a cheese number. A quarter of it builds cheese and more than a third builds bottled and value added milk. Anyone sizing United States cheese supply off the headline will overstate it.
Two things decide the competitive picture. The first is who pays most for the milk. A protein shake plant can pay on volume rather than on cheese yield. The second is which cheese types the money is actually buying. Italian types grow and cheddar falls, so the mix matters more than the total.
For producers and buyers, one thing now matters most. How many tonnes of each cheese type will this money really add? A dollar figure cannot answer that. Our Global Cheese Database 2026 carries production, imports, exports and consumption for 39 cheese types across 48 markets, in tonnes.
Going deeper on this market? See the Global Cheese Database 2026.

Global Water Dispense Market Reports 2026
Coolers, dispensers and operators across 35+ markets, with forecasts to 2030.
More information
Global Cheese Database 2026
Production, imports, exports and consumption for 39 cheese types across 48 countries, with actuals through 2025 and forecasts to 2030. Buy one market or any five with a single-user, departmental or corporate licence, or get your free database and report sample first.
Get your free database & report sampleStrategic Insights
📊 Analytics & Strategic Insight
The United States is building a milk handling industry more than a cheese one
The decision most in this industry are avoiding:
👉 A dollar total says nothing about tonnes. The count gives money by group and no volumes. Cheese supply growth has to be worked out another way.
👉 Filtered milk plants outbid cheese vats. They pay for volume and protein rather than for cheese yield. The milk pool is the same pool.
👉 The cheese money is buying Italian types. Mozzarella and Italian output both grew in August. Cheddar is losing ground inside a growing total.
Here's the full context:
→ 2025: The trade body counted $11 billion across 19 states. Cheese led the groups at $3.20 billion.
→ 5 August 2026: Fairlife broke ground at Coopersville in Michigan. The build adds 4 million pounds of milk a day.
→ 20 August 2026: The Webster plant in New York reached its ramp up. It takes 5 to 6 million pounds of milk a day.
→ October 2026: United States cheese output for August rose 1.4%. Cheddar and American types both fell 0.9%.
→ Most recent: The count reached $15 billion on 20 October. Milk and cream passed cheese at $5.63 billion.
What this means for cheese producers, traders and buyers:
✅ Plan for tighter milk in the Midwest and the North East. New filtered milk plants are bidding for the same supply. Cheese margins feel that first.
✅ Italian cheese is where the growth sits. Mozzarella rose 1.8% in August and Italian types 3.7%. Cheddar went the other way.
✅ Export prices still set the return on new vats. USDA reported softening export demand in mid October. Cheese was long in the West.
What this means for market decisions:
1️⃣ The United States is less of a cheese growth story than the total implies. Cheese holds a quarter of the money. Size the market on tonnes by type.
2️⃣ Filtered milk and protein brands are the new rivals for milk. They are buying volume at scale in New York and Michigan. Cheese makers meet them on price for milk.
3️⃣ An entrant should test the milk balance before the plant case. Ask what the local pool is committed to through 2030. The vat is the easy part.
The Zenith view:
The count proves that money is moving into milk handling faster than into cheese. It does not prove that cheese output will stall. Cheese still holds $3.76 billion and Italian types are growing. One thing decides the case. How many tonnes of each cheese type does the money add, and in which markets?
The data behind this story
🧀 Global Cheese Database 2026
Production, imports, exports and consumption for 39 cheese types across 48 countries, in tonnes, with actuals to 2025 and forecasts to 2030. The 2026 edition is being built market by market. Waitlist members get the pre-launch price and a free sample country chapter.
→ Join the waitlist
Weighing a cheese market or a dairy investment? Zenith helps food and beverage companies assess market size, growth, competitors, pricing and route to market before they invest.
→ Discuss your market
Zenith Consulting
Submit your food & beverage project enquiry.
Share your requirements. If there is a strong fit, we’ll come back with an indicative investment range, project timeline and recommended strategic approach.
Reviewed by Zenith Consulting’s senior food & beverage strategy team.
Our market reports
All reports and databases Available now
Global Aseptic Packaging Market Report 2026
39 markets, 2025 actuals and forecasts to 2030 by category, region and pack type.
View report- Available now
Global Cheese Database 2026
48 markets and 39 cheese types: production, trade and consumption to 2030.
View report  Available now
UK Water Drinks Reports 2026
Plain, flavoured and functional water in the UK: companies, brands, own label and forecasts to 2030.
View report Register interest
Global Water Database 2026
Packaged, bulk, flavoured and premium water in 86 markets, to 2030.
View report Register interest
Global Premium Bottled Water Report 2026
Premium water volume, value and brands, with six country deep dives.
View report- Available now
Global Water Dispense Market Reports 2026
Coolers, dispensers and operators across 35+ markets, with forecasts to 2030.
View report
Related analyses
- Health, Nutrition & Functional
Leprino's 35 Million Dollar Lubbock Whey Expansion Will Finish Other Cheese Makers' Protein
Leprino Nutrition has completed a 35 million dollar expansion at Lubbock, Texas, quadrupling its microparticulated whey capacity. The new line will finish whey solids bought in from other cheese makers, which moves the tight step in the chain away from the vat.
Read analysis → - Health, Nutrition & Functional
West Europe Aseptic Volume Falls To 27.2 Billion Litres While Pack Numbers Return To Growth: UHT Milk Drops 2.1% A Year
West Europe filled 27,191 million litres of aseptic product in 2025. It is the only region falling on litres both to 2025 and to 2030, yet its pack count returns to growth by 2030.
Read analysis → - Health, Nutrition & Functional
Sports And Energy Drinks Reach 39,180 Million Litres, And Aseptic Filling Has Almost None Of It
Sports and energy drinks are the fastest growing group on the world drinks shelf at 39,180 million litres in 2025, up 7.2% a year since 2020. Zenith's Global Aseptic Packaging Market Report 2026 books just 100 million litres of the United States total as aseptic.
Read analysis →
Share it with your peers
Pass this analysis to colleagues who track the food and beverage market.
Zenith Market Intel
Need a specific food or beverage market report?
Tell us which category, region or question would be useful for your team.
Sister Publication
Also follow our Water Dispense Market Intelligence
Category analyses, operator briefings, and investor signals across the global water dispense market.